Multiple Seismic Stations
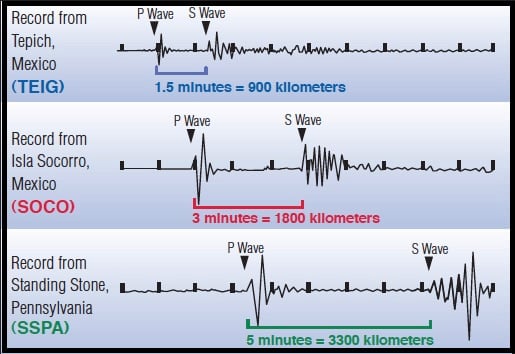
To figure out just where that earthquake happened, you need recordings from seismic stations in other places. While earthquake locations are normally done with a computer that can quickly determine the paths of seismic waves through the Earth to many seismic stations, you can get a good estimate of an earthquake location using a map, a ruler, a pencil, and a compass for drawing circles on the map.
Here are examples of a seismograms from different places in North America that recorded the same earthquake. Distances from the stations to the earthquake are estimated from the difference between P and S wave arrival times:

Finding the Distance to the Epicenter
- Measure the distance between the first P wave and the first S wave. In this case, the first P and S waves are 24 seconds apart.
- Find the point for 24 seconds on the left side of the chart of simplified S and P travel time curves and mark that point. According to the chart, this earthquake's epicenter was 215 kilometers away.
- Measure the amplitude of the strongest wave. The amplitude is the height (on paper) of the strongest wave. On this seismogram, the amplitude is 23 millimeters. Find 23 millimeters on the right side of the chart and mark that point.
- Place a ruler (or straight edge) on the chart between the points you marked for the distance to the epicenter and the amplitude. The point where your ruler crosses the middle line on the chart marks the magnitude (strength) of the earthquake. This earthquake had a magnitude of 5.0.
Finding the Epicenter
You have just figured out how far your seismograph is from the epicenter and how strong the earthquake was, but you still don't know exactly where the earthquake occurred. This is where the compass, the map, and the other seismograph records come in.
- Check the scale on your map. It should look something like a piece of a ruler. All maps are different. On your map, one centimeter could be equal to 100 kilometers or something like that.
- Figure out how long the distance to the epicenter (in centimeters) is on your map. For example, say your map has a scale where one centimeter is equal to 100 kilometers. If the epicenter of the earthquake is 215 kilometers away, that equals 2.15 centimeters on the map.
- Using your compass, draw a circle with a radius equal to the number you came up with in Step #2 (the radius is the distance from the center of a circle to its edge). The center of the circle will be the location of your seismograph. The epicenter of the earthquake is somewhere on the edge of that circle.
- Do the same thing for the distance to the epicenter that the other seismograms recorded (with the location of those seismographs at the center of their circles). All of the circles should overlap. The point where all of the circles overlap is the approximate epicenter of the earthquake.

